04.3.2020
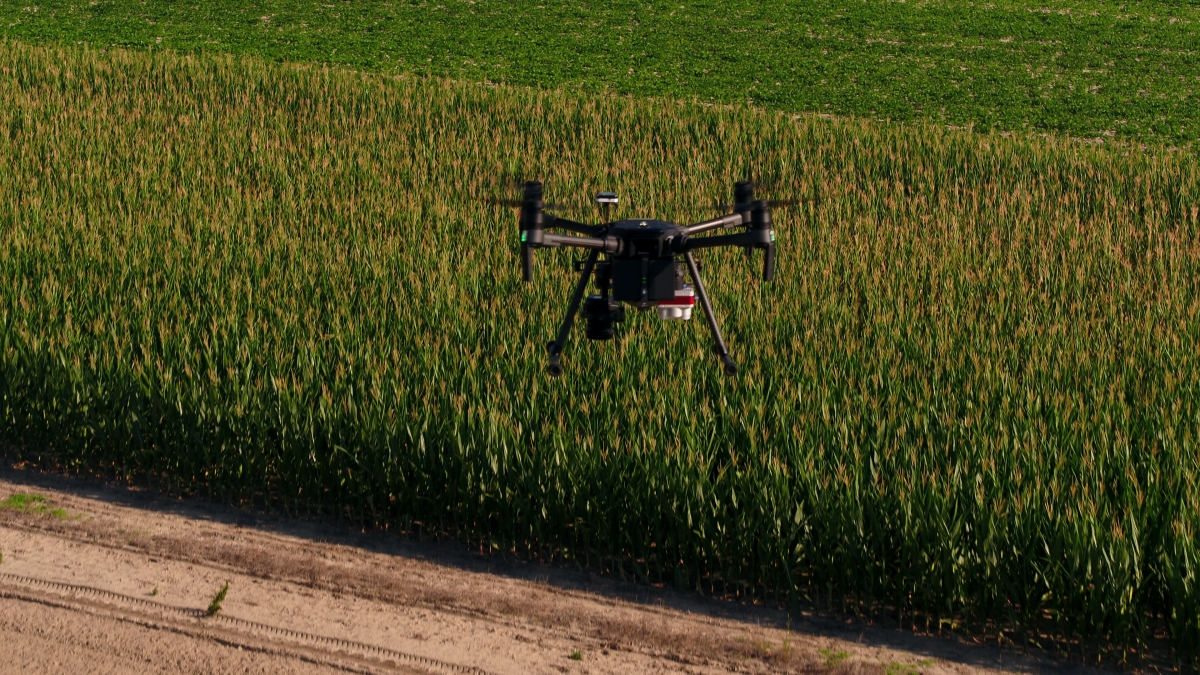
This year, as farmers began harvesting corn across the U.S., they found that the unusually cold and wet spring, followed by a summer with heavy rains in some regions, resulted in a reduced yield. Like environmental extremes, disease, insects, and other stressors can hamper the potential of a cornfield--issues that can be difficult to manage due to the crop’s sensitivity to nutrients, overwatering, and chemical exposure. Since corn yield loss accelerates at a rate of 1.1 bu/acre per day as planting moves further into June. getting timely and accurate insight into a corn crop’s performance is crucial. In critical early growth stages, drone-based agriculture technology can help corn farmers mitigate threats to their profitability by providing detailed information about their crop’s health and yield potential.
The role of drones on the farm has emerged as farmers embrace precision agriculture in growing numbers. It’s a diligent practice, requiring its practitioners to measure the various health characteristics of their crops throughout the growing season. When signs of stress arise, precision farmers take action, sometimes down to a granularity of a few square feet. The benefit is that, by more precisely managing their crops, corn growers can reduce inputs and intensify yield. Drone technology enables farmers to gather the quality and quantity of data required for precision crop management, in a timely and efficient manner.
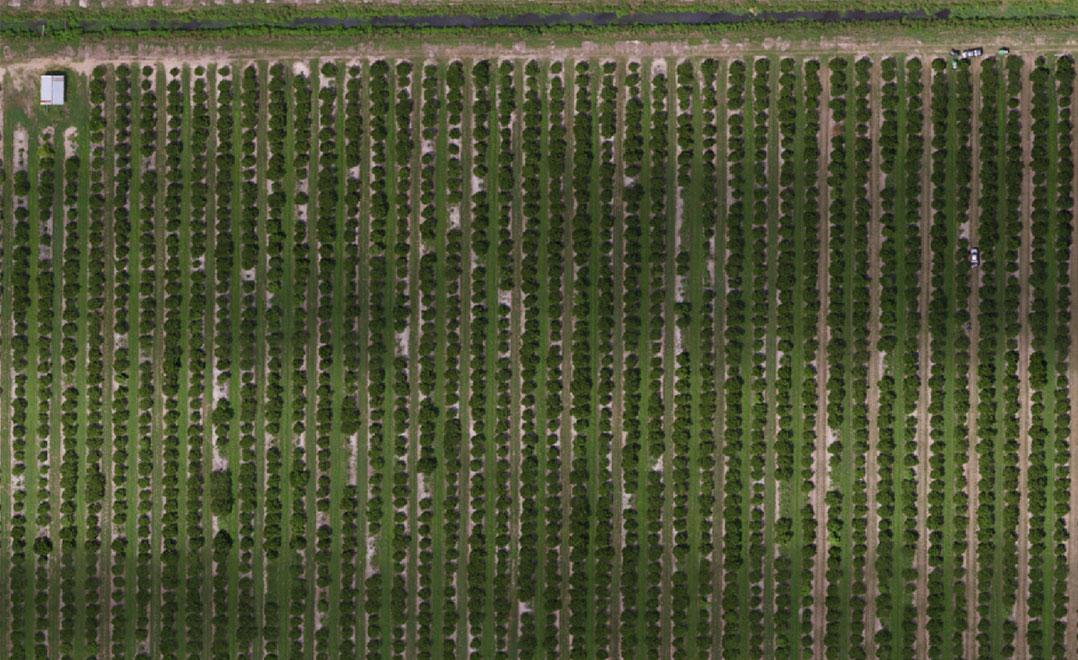
Regardless of whether or not a grower has implemented precision agriculture on their farm, there are many ways they can use drone-based aerial intelligence when managing corn. They can scout hundreds of acres of corn in a single day by flying a drone. By capturing visual and multispectral data as they fly, they can get an accurate stand count as early as V2. With high-quality, multi-sensor imagery and analytics, they can track crop progression, manage nutrient input, and make replanting decisions. Ultimately, farmers maximize their profitability by using this information in making more efficient and effective planting and input decisions.
On corn farms across the world, drone-based crop scouting and precision management are supplanting labor- and time-intensive traditional crop management practices:
- Where before, farmers estimated plant counts by sampling the number of corn plants in 1/1000th of an acre to extrapolate the number of plants per acre, they can now use drones and artificial intelligence to quickly and precisely count plants in an entire field.
- In the past, farmers watched for disease and drought stress in their corn by taking random soil samples and “eyeballing” issues such as rolling, browning, and yellowing. Now, they apply a vegetative index to drone imagery to identify patterns and early indicators of stress across their entire corn field.
- Rather than spraying or watering broad swaths of corn crops, they can now produce precise herbicide, fungicide, and pesticide prescription maps, as well as develop zonal irrigation strategies.
- Though satellite imagery has its uses in managing corn, it falls short of the resolution and turnaround times of drones.
Our Drone-based Corn Management Solution
“Profitability has become more difficult to attain in the agricultural industry,” said Kevin Lang, General Manager of Agriculture at PrecisionHawk. “Part of our mission here at PrecisionHawk is to provide tools for growers, crop consultants, insurers, and enterprise professionals in agriculture to make better, more timely decisions to ensure they aren’t leaving profits in the field.”
The key to making such decisions is implementing a simple, streamlined solution for collecting, processing, and analyzing data. One that gives farmers greater access to information about their farming assets and day-to-day operations. With the right analytics software, drones can be a powerful tool for deriving insights from information about crop health.
With our streamlined, drone-based solution, farmers can:
- Collect: fly a range of ready-to-fly drone and sensor hardware, including cutting-edge multispectral and thermal sensors, to gather high-quality data
- Process & Analyze: use vegetative indices to surface early indicators and trends in plant health, automate plant counting, and compare field zones or overall farm performance over time
- Report: generate prescription maps and customized PDF reports and export directly to a farm management system
Whether farmers are looking to optimize profitability by making more efficient input decisions, select crops with the greatest market potential for that growing season, or track decisions and performance across multiple growing seasons, our data value chain serves as a turnkey means of implementing drone-based aerial intelligence on the farm.
Collect High-Quality Corn Crop Data
“We’re never going to be as good as the raw data we collect,” said Bobby Vick, Director of Agriculture at PrecisionHawk. “So we need to get it right when we’re in the field to ensure we get optimal analytics on the back end.”
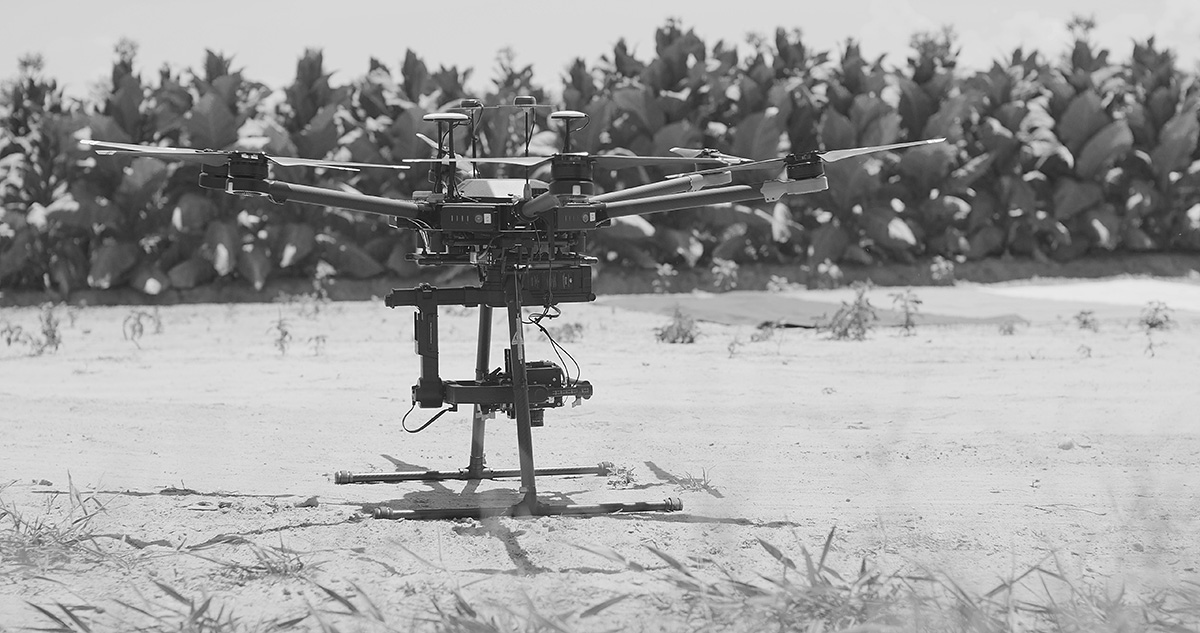
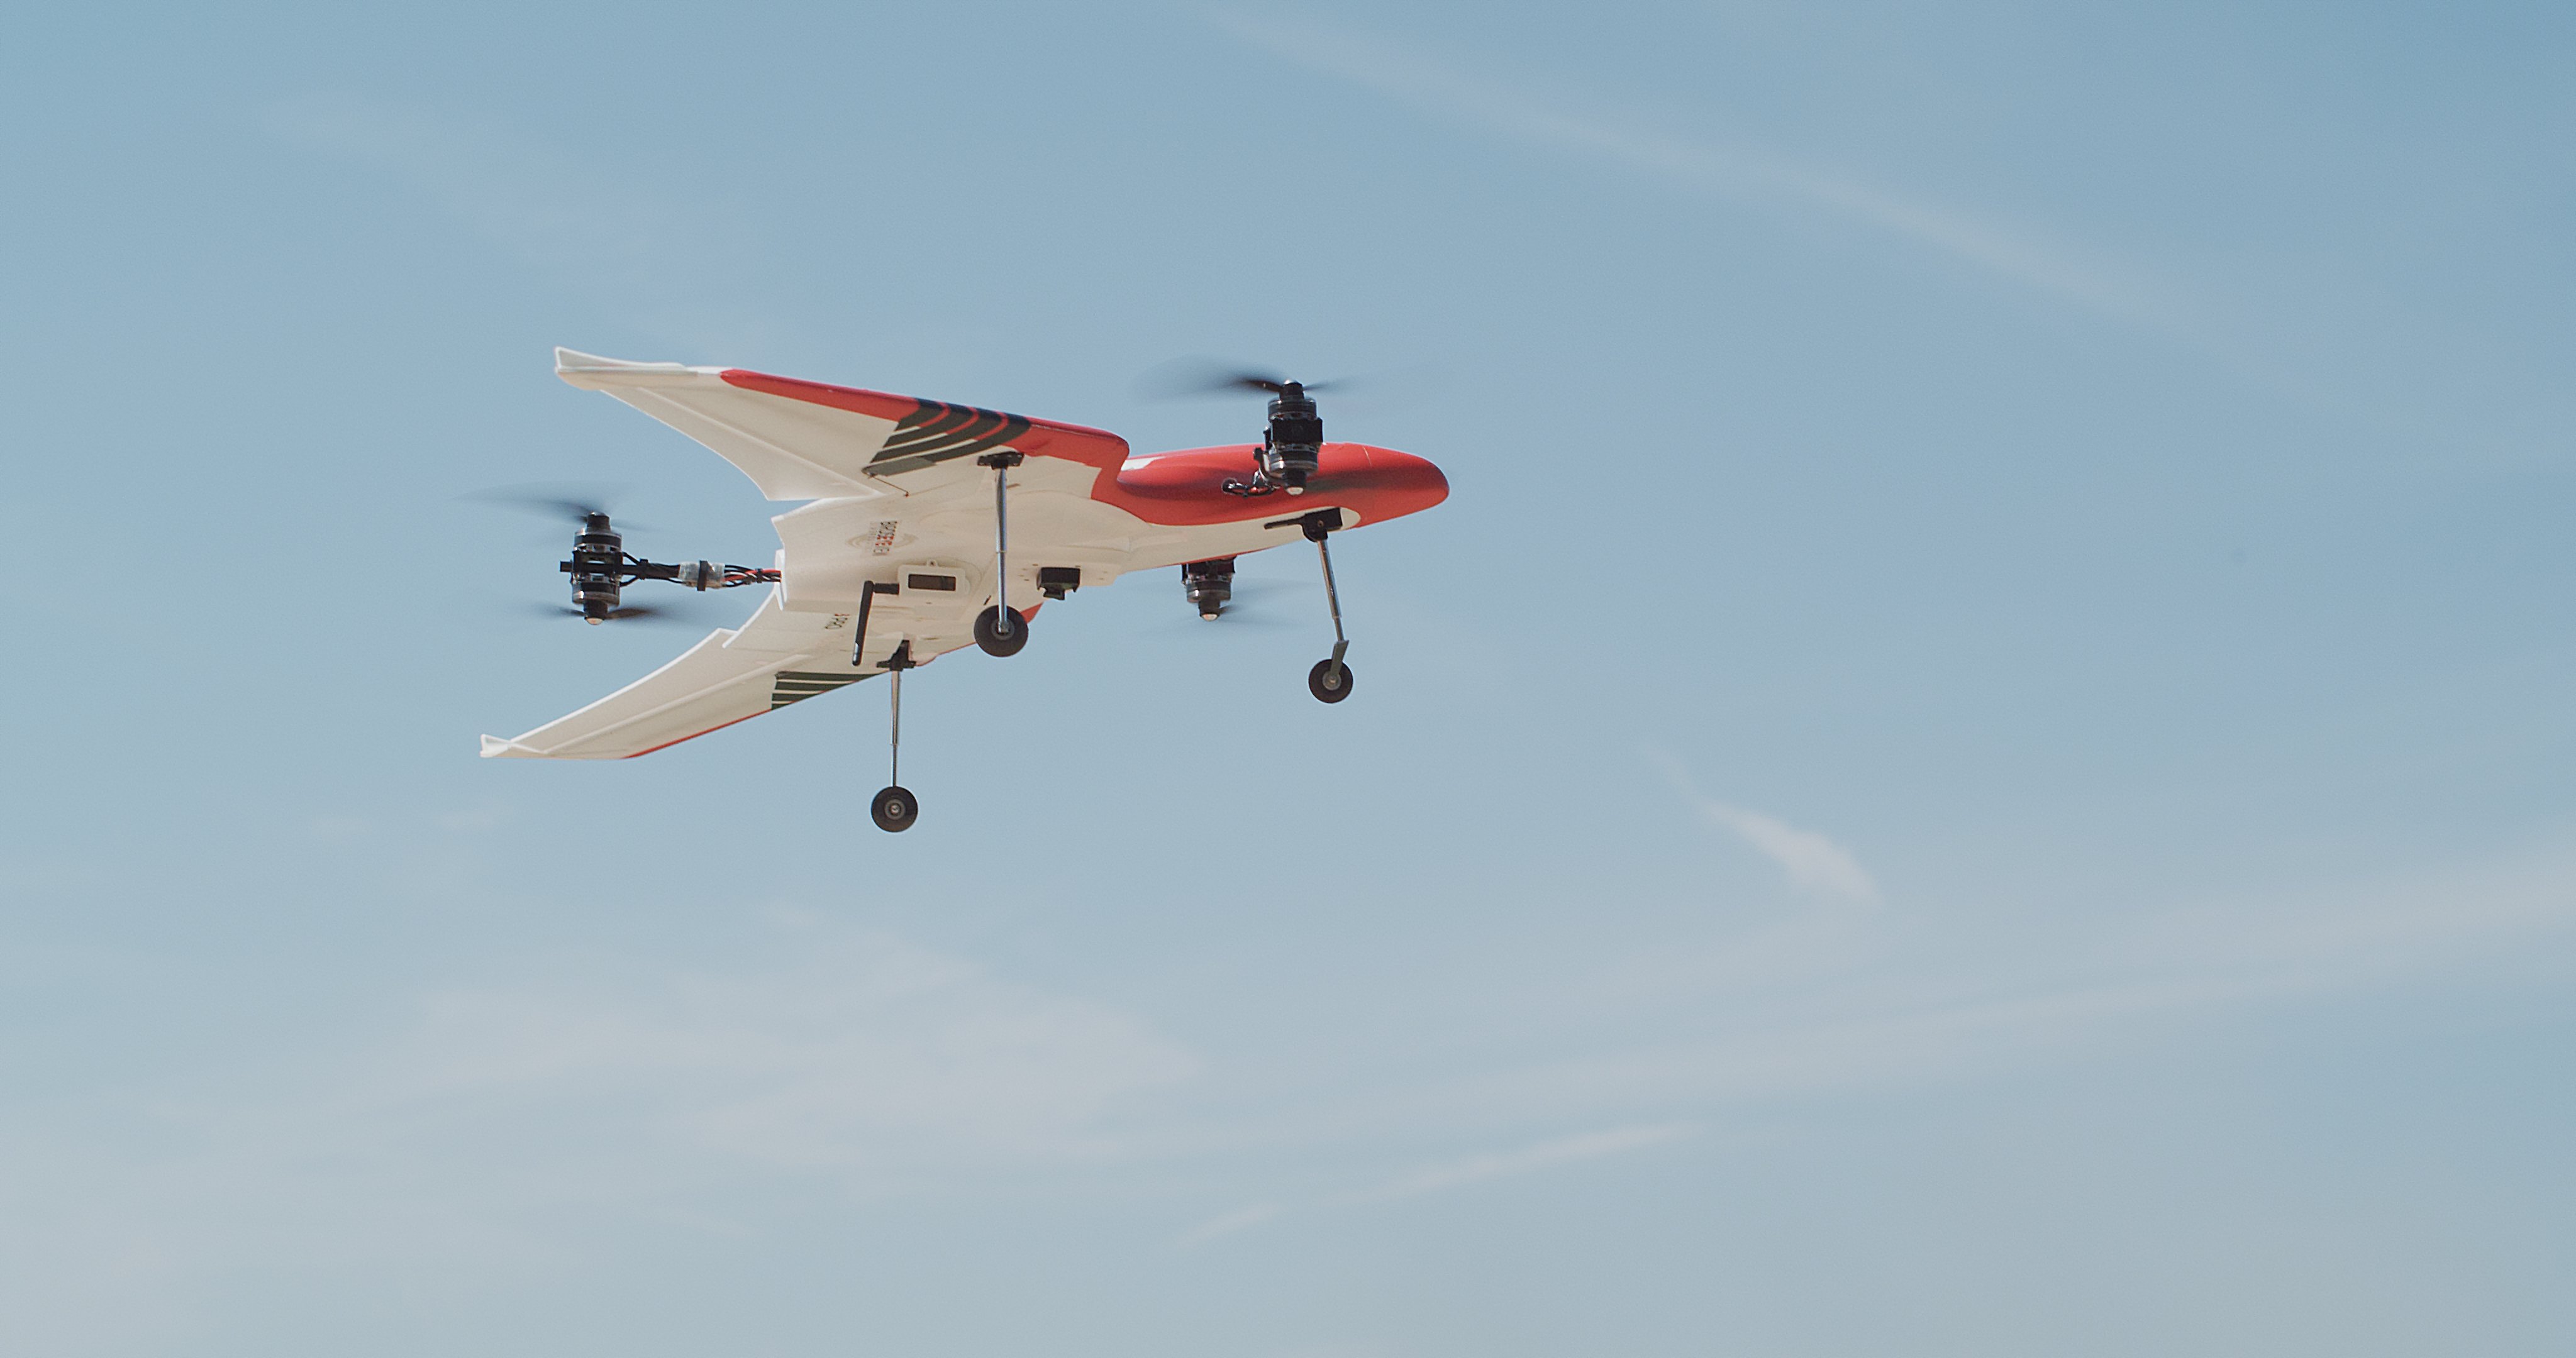
At PrecisionHawk, we offer a range of ready-to-fly flight and sensor hardware, suitable for corn applications, including industry-leading MicaSense RedEdge and Altum sensors. Our drone portfolio includes a range of multirotor and fixed-wing VTOL (Vertical Take-off and Landing) drones. Any of these drones can be flown at low altitudes and slow speeds by operators, allowing them to distinguish between corn leaves and shadows, ultimately providing a more accurate stand count. Fixed-wing VTOL aircraft can takeoff in small areas and cover hundreds of acres in a single flight.
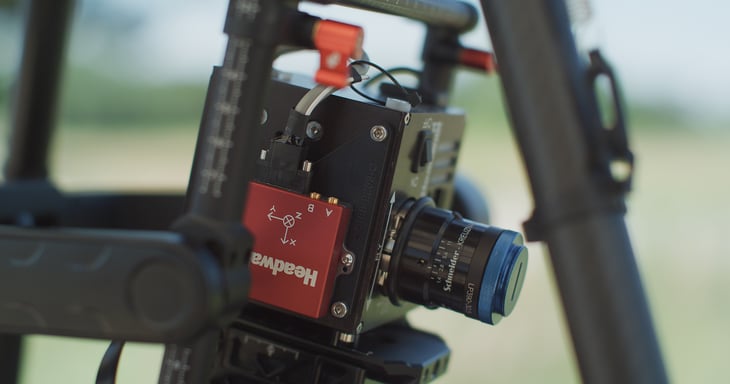
For corn crop scouting and analysis, farmers can start with multirotor DJI Phantom 4 or DJI Mavic drones outfitted with RGB sensors. Operators seeking greater precision and insight into the corn crop can use the DJI M200 drone equipped with a MicaSense RedEdge or MicaSense Altum sensors. MicaSense’s sensors are purpose-built for precision agriculture. By capturing very narrow spectral bands, between 10-40 nanometers wide, they’re able to detect subtle changes in plant color throughout the corn growing season.
“We stuck to the scientific basics of capturing very narrow, discreet bands,” Drew Baustian, Business Developer at MicaSense, said in an interview. “RBG cameras capture those 5 bands and no other data. We’re picking up small changes in reflectives at different points along the profile, and using that data to better understand the physiological changes occurring in the crop.”
After collecting the data, it’s time to analyze it using a streamlined, cloud-based system.
Process and Analyze Corn Crop Data with PrecisionAnalytics
PrecisionAnalytics Agriculture is a complete aerial mapping, modeling, and agronomy platform based on 10 years of agriculture analytics experience and millions of acres of crop data. The system automatically processes, organizes, and annotates geospatial data. It also applies machine vision to automatically produce rich data visualizations, as well as machine learning to surface trends and patterns in crops.
In PrecisionAnalytics Agriculture, a farmer can monitor crop health, verify stand establishment, and run a myriad of other analytic reports within minutes:
- Crops at a glance: Review the overall health of plants to surface issues such as over-fertilization, flooding, or disease.
- Detailed views: View full-resolution imagery and zoom in on issues such as damp or sparse areas.
- Geolocation: Quickly identify where an area of concern is relative to your position
- Instant precision plant count: Define an area and quantify the number of plants in it.
- Vegetative Indices: Use indices like NDVI, GLI, and VARI to identify early indicators of and trends in crop stress.
- Zonal and plot statistics: Shape analysis to the unique characteristics of a field by defining custom zones or creating automatic and custom-defined plots.
- Elevation view: Identify areas of damage, expressed as variations in elevation, and use the measurement tool to calculate the acreage impacted.
- Comparison view: View multiple datasets at a time to analyze trends in crop growth.
- Multi-farm and -field management: Navigate all properties and associated data in a single, streamlined portal.
Plant Counting
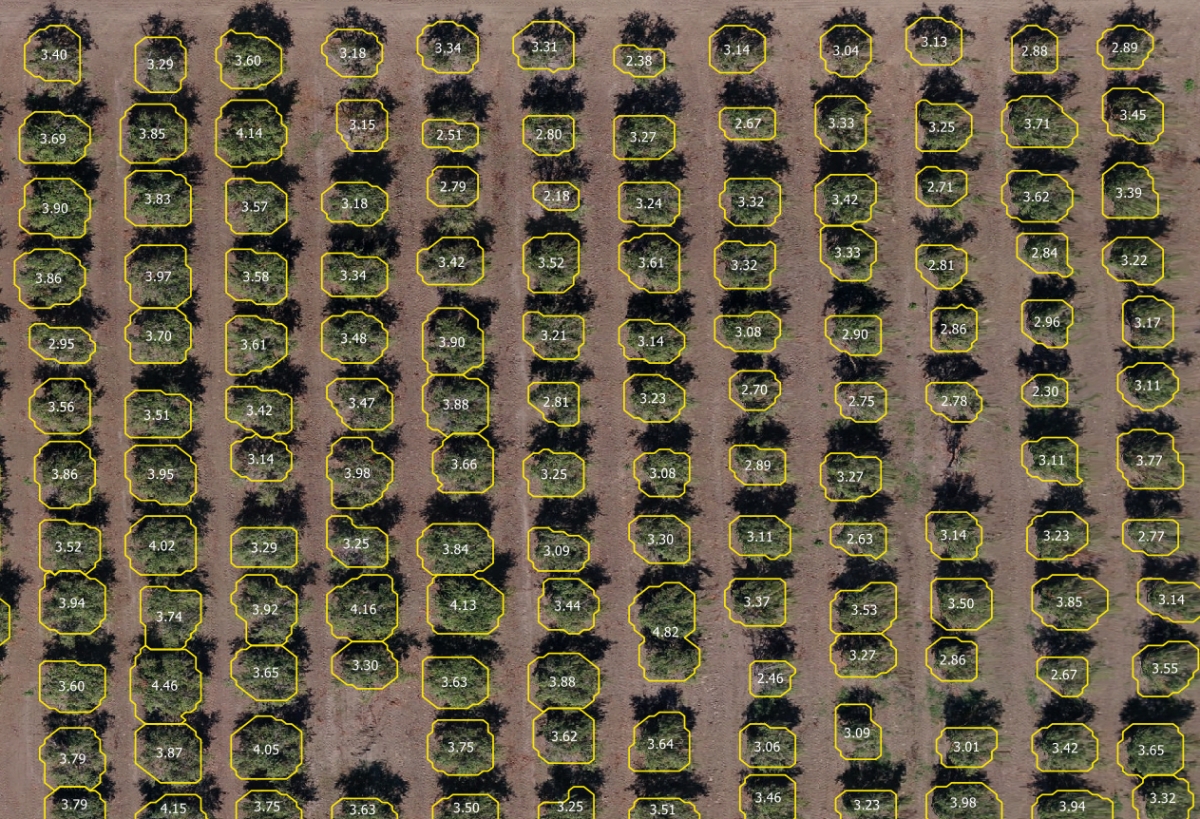
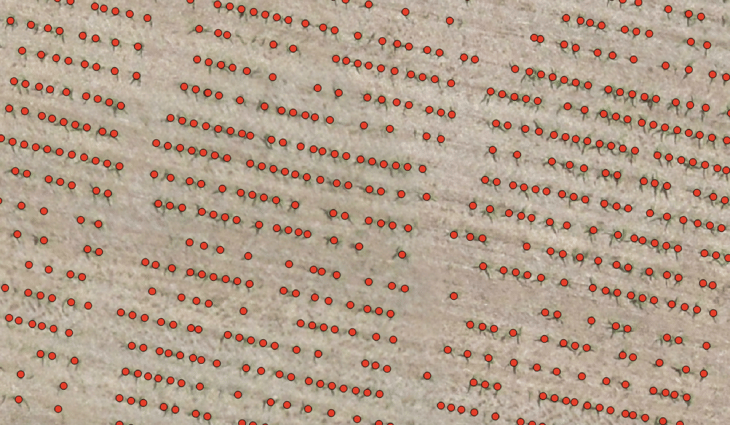
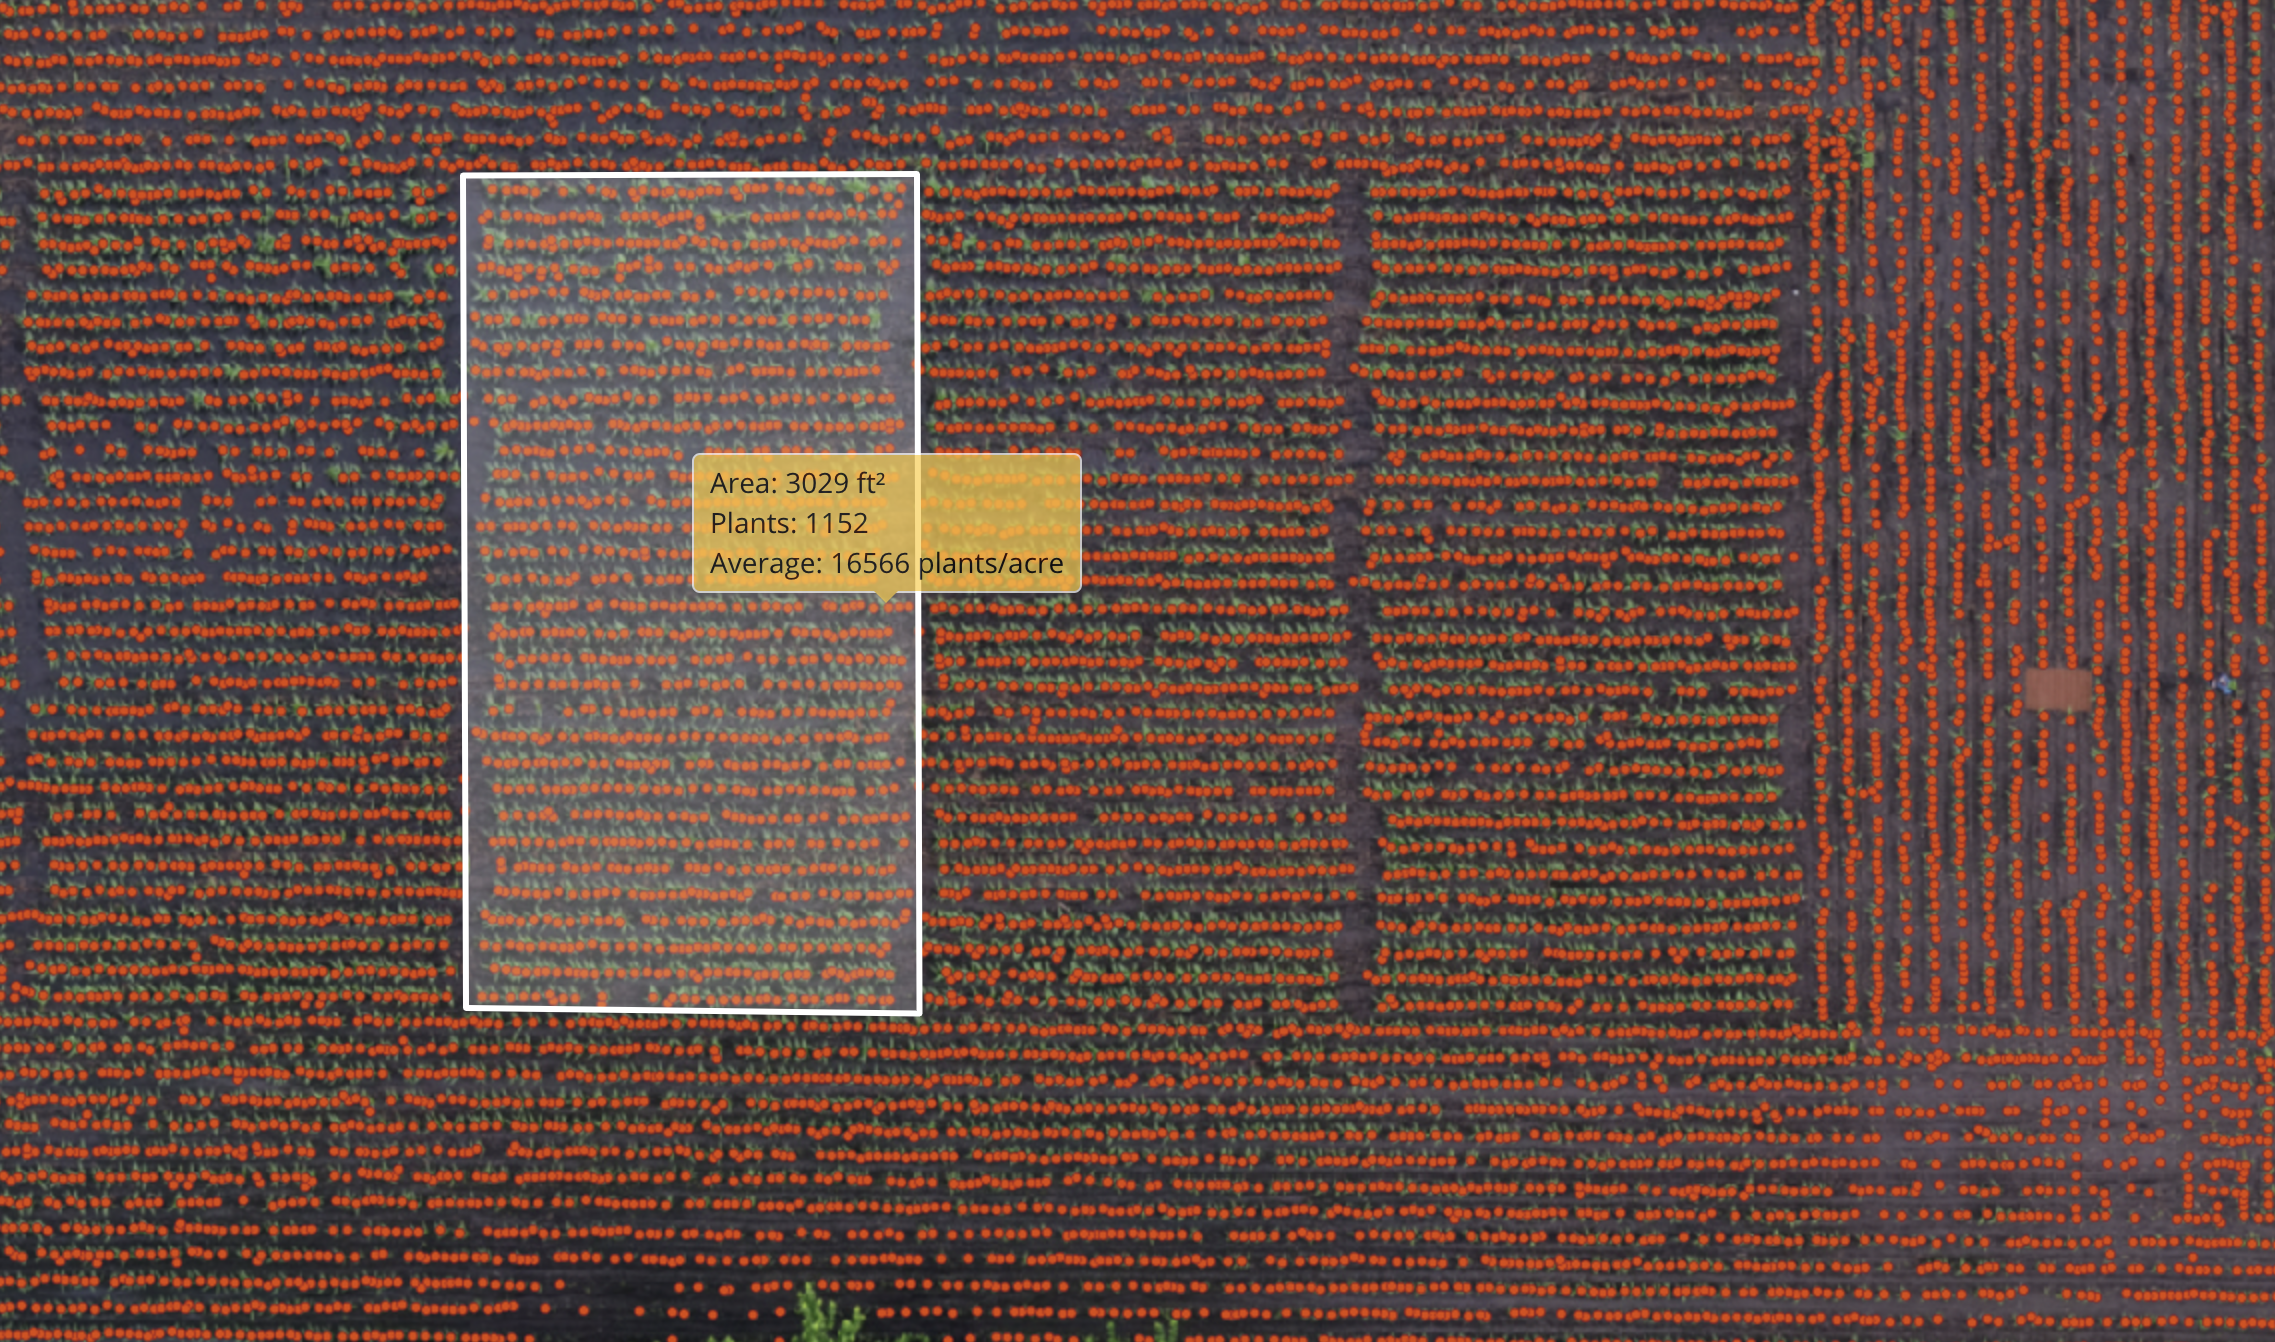
Users of PrecisionAnalytics Agriculture can apply the Plant Counting and Sizing tool over an area of interest to analyze crop emergence, segment crops by size, and track plant development throughout multiple growth stages. With this tool, a dot will appear over every corn plant counted, resulting in a highly accurate count of the number of plants per acre. Each dot is colorized to indicate its size relative to the entire plant population. Users draw perimeters for ad-hoc counts or establish zones to compare multiple parts of the field.
Missing plants could indicate there was a planting equipment failure, or that the ground was too wet for the seeds to germinate. Farmers can get a precise count of plants that have emerged and those that have not, and quickly surface patterns of emergence in particular rows, zones, or custom plots. As a result, they can catch more replanting opportunities to maximize the yield potential of their field.
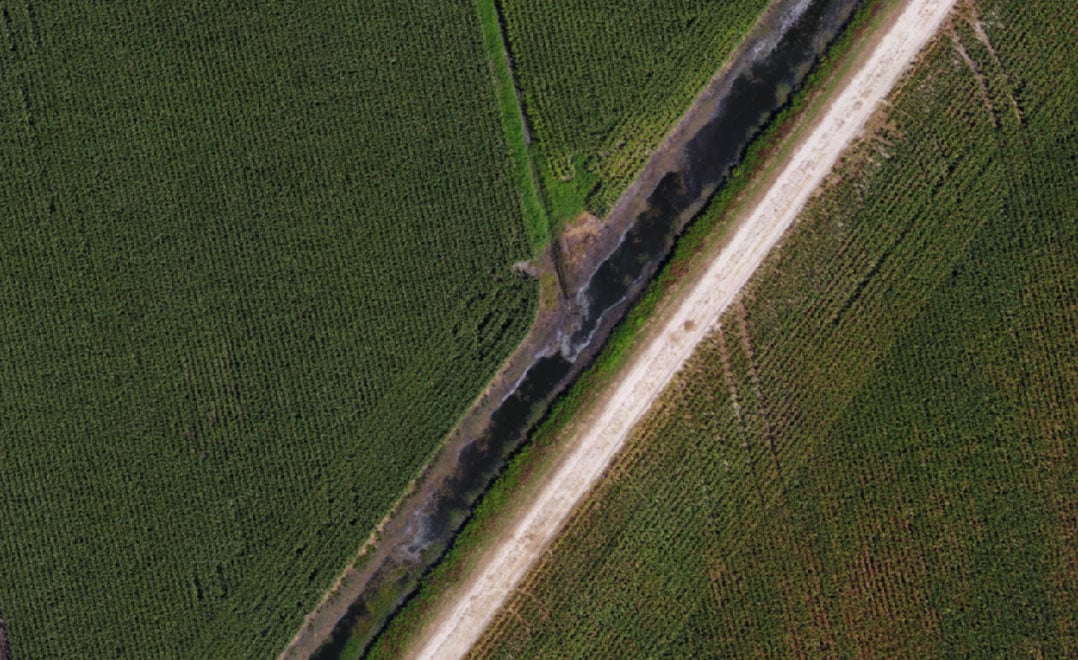
After a storm, the farmer can use Elevation View to analyze the difference between the height of the corn and the ground. Particularly useful later in the season, this tool shows a darker green where the elevation dips, and lighter green where the elevation rises, such as the canopy of the corn. Farmers can use Elevation View to assess where there might be green snap, lodging, or an entire stand laid flat. This enables them to quickly decide if the crop is salvageable and whether to file a crop insurance claim.
Vegetative Indices
Farmers can upload data they’ve collected over their cornfields to PrecisionAnalytics Agriculture and apply precise vegetative indices that indicate vigor and crop color. This allows software users to instantly identify an area of concern and assess what went wrong and how to fix it.
By simply clicking a button, users can apply a vegetative index, such as NDVI or VARI, and instantly see a green versus red overlay of their imagery. The green areas indicate the strongest vegetative vigor, with grades of orange, yellow, and red indicating diminishing vigor. These gradations can be adjusted to clarify corn crops from grass and weeds, as well as plants that are healthy versus those that are not.
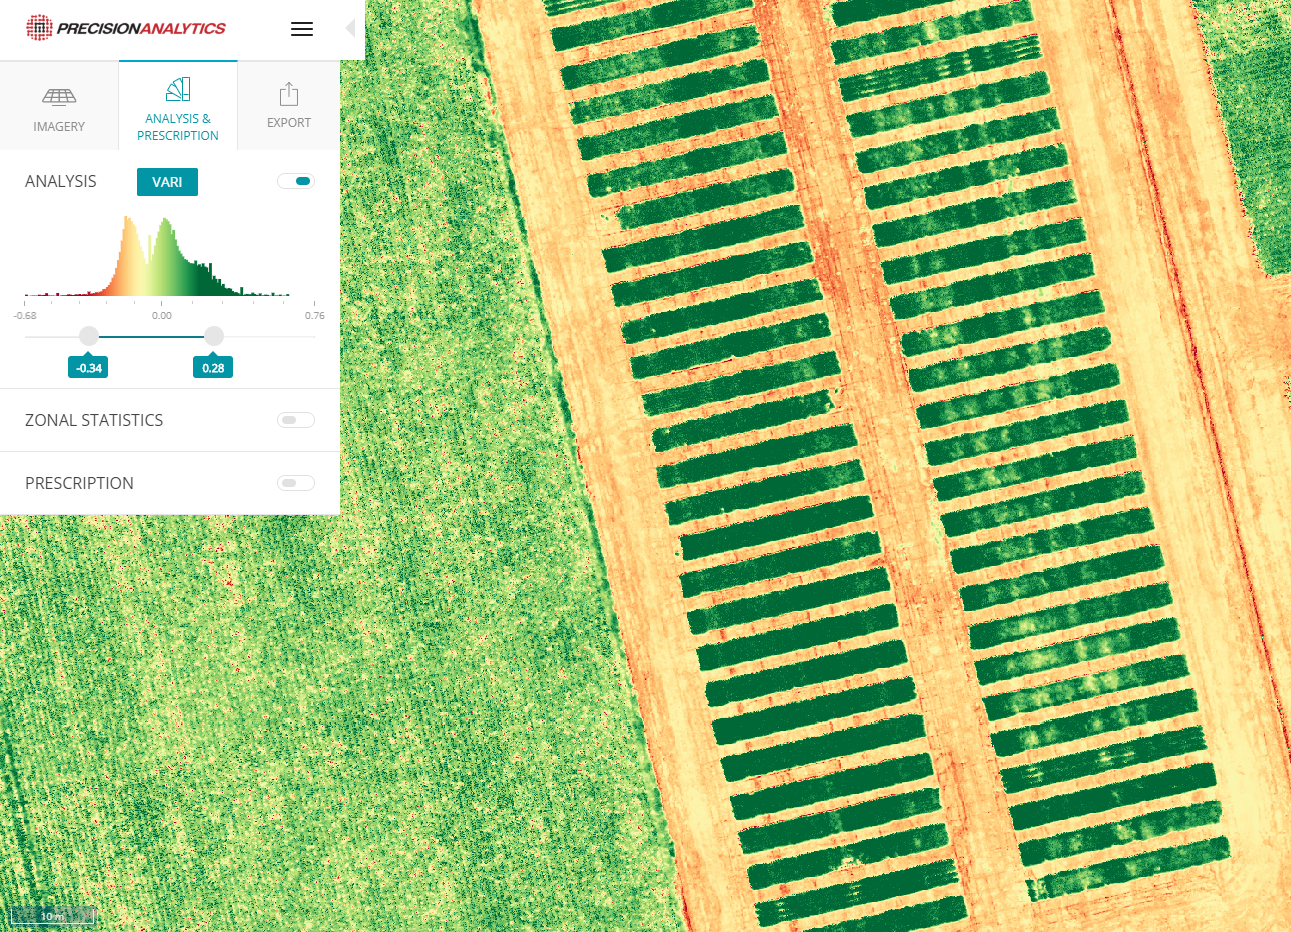
This enables farmers to detect early indicators of stress stemming from crop diseases, such as blight, rust, and corn grey leaf spot, when there is still time to manage inputs or replant. Stressed plants identified by a vegetative index might also indicate issues with irrigation or pressure from weeds, such as ragweed and velvetleaf. Corn, a famously nutrient-sensitive crop, might also appear stressed in an NDVI or VARI analytic owing to nutrient deficiency or toxicity.
As ever, ground-truthing is the best way to diagnose a particular issue. But, applying a vegetiative index to a corn field in PrecisionAnalytics Agriculture helps farmers focus on the areas requiring attention. They can then go directly to the source to verify it and further assess the cause of the issue on the ground. Additionally, these insights enable farmers to efficiently manage inputs, especially nutrients. Rather than spraying herbicide over an entire cornfield because of scouting a few weeds in one section, farmers can make more precise decisions that enable them to save resources and improve plant health, thereby maximizing zonal efficiency.
Those farmers owning precision applicators can use PrecisionAnalytics Agriculture to translate vegetative indices into prescription maps for their cornfields. The system automatically breaks up vegetative vigor into tiles as small as 3-square feet. This enables the user to dictate a pound-per-acre (lb/acre) application of nitrogen, phosphorus, and/or potassium. Then, the user can export a prescription file directly into a farm management system for fertilizer application.
Custom Zones and Comparison View
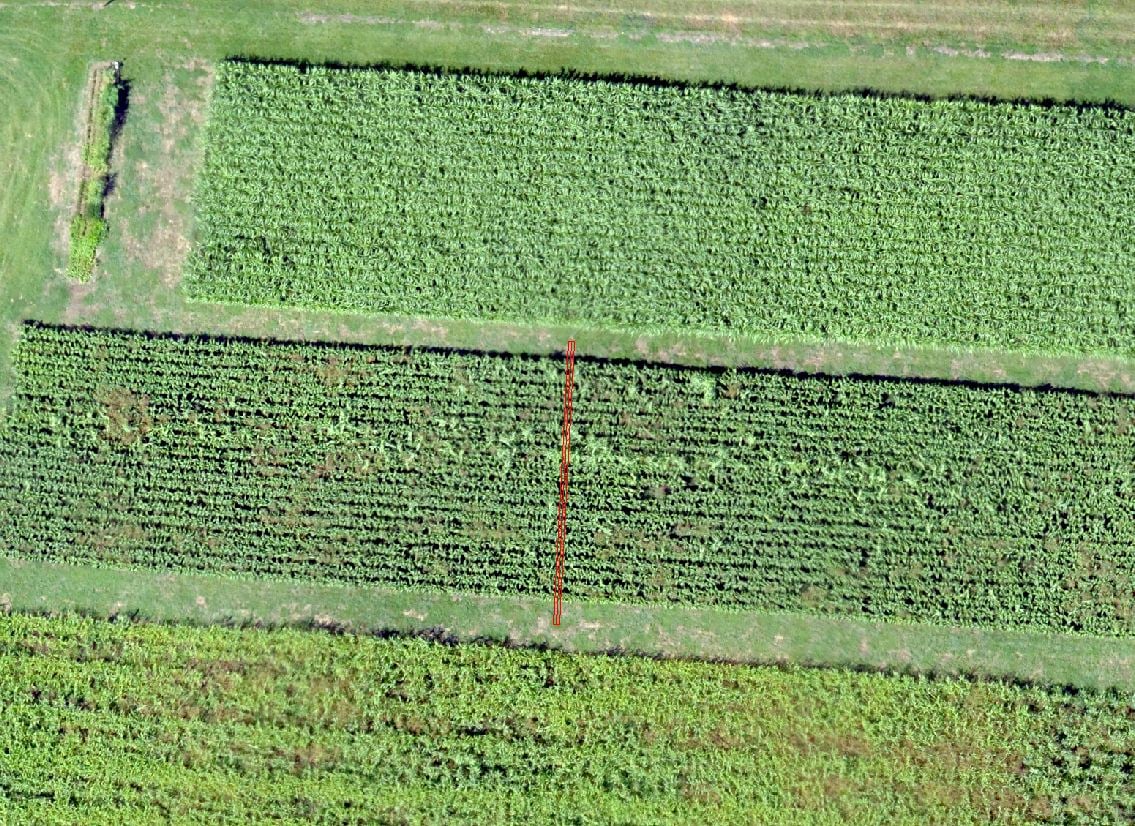
PrecisionAnalytics Agriculture’s zonal tools enable farmers to build management zones in corn fields to determine specific areas of stress, in need of nitrogen, water, or pesticides, and manage inputs for that zone. By building management zones, farmers can subdivide their field into smaller zones (for instance, a group of 10 rows, or 1000 acres), and number those zones.
The Comparison View in PrecisionAnalytics Agriculture enables farmers to see how successful they were in planting corn, from planting to harvest, across large acreage. From emergence and first leaf collar to maturity, users of the software can track how their management strategies impacted the trajectory of their corn yield.
Reports
Users can also view and share live links and dynamic PDF reports that focus communication for a variety of stakeholders, whether they be agronomists, buyers, or farmhands. With a simple checkbox interface, users can select the layers of data they choose to share in the map. They can also zoom in on a specific area of interest and have all components of the report update to focus on just that area.
Improving Corn Variety Research with PrecisionAnalytics
Want to analyze how a corn plant develops and survives under different environmental conditions? With PrecisionAnalytics Agriculture, researchers can compare count and vigor across their crop on a plot-by-plot basis and derive plant health measurements from a mature and dense corn crop. By flying drones over the field, researchers can begin to identify plants early on in the growing cycle to better monitor plant health, stressors, and emergence trends.
With PrecisionAnalytics, researchers can:
- Get a precise stand count, in early vegetative stages, on corn planted up to 40,000 plants/acre in density
- Use custom plot statistics to define plots and compare counts from plot-to-plot
- Capture bare-earth data for benchmarking
- Use vegetative indices to quantify the impact of treatment differences (such as varieties of corn, nutritional inputs, and chemistries) across plots
- Use comparison view to toggle between datasets and analyze year-over-year trends in crop growth
With zonal and plot statistics, researchers can custom-define the perimeter of a plot--be it a row or a group of 10 rows--and get a count of the number of plants per acre in that plot. This enables researchers to track trends in emergence and plant health across different plots, indicating how differences in nutritional inputs, soil, water, or fertilizer affect the growth of the plots over time.
Why PrecisionHawk?
With years of experience collecting data in the agriculture industry, using aerial mapping to scout crops, our data scientists and engineers have developed some of the best-trained machine learning models in the industry. That means our algorithms and indices, including our stand count tool, are better able to detect individual crops and deliver precise analytics about count, sizing, and health based on terabytes of data across a wide variety of crops and soil types. Additionally, our years of working with leading agronomists have informed our intuitive framework, built for multi-field and multi-form data management and sharing. As a result, farmers can learn how successful they were in planting corn, from planting to harvest.
We’re here to help you adopt smarter and more efficient farming practices. Our agricultural experts will assist in evaluating when, where, and how to incorporate drone-based aerial intelligence into your operations. Our global network of drone operators is ready to execute flights on your behalf. And our engineers are continuously optimizing PrecisionAnalytics Agriculture to better automate and accelerate your analysis.
Contact us today for more information on how you can use drone-based aerial intelligence in your operations.