12.19.2019
How accurate are your plant count numbers?
When you’re quoting a new crop insurance policy, you need to know exactly what you’re covering. And when a current customer comes to you with a claim, you need to get a precise accounting of the loss.
If you’re using traditional methods to count plants, inaccurate results may be causing you to make less-than-ideal business decisions.
The Case for a New Way to Count Plants
Over 330 million acres of farmland were covered by 1.1 million policies in 2018—up by 20 million acres from 2017.
As the number of policies is growing, so is the effect of adverse weather. “Farmers were unable to plant many rain-soaked fields in 2019,” reports Agri-Pulse. “About 19.1 million acres were covered under prevented planting provisions in insurance policies and the indemnity payments have already reached almost $4.3 billion.” And the USDA predicts that flooding may be also an issue in 2020 thanks to a wet winter.
With the scale of crop coverage growing and adverse weather causing problems, it’s crucial that crop insurers have a way to get accurate accounts of plant numbers to avoid under- and overpayments.
Traditionally, crop insurers use manual methods to obtain a plant count. For example, they may count the number of plants in 1/1000 of an acre, or the number of plants that can fit inside a hula hoop, and then multiply to get an estimate. Or, after a report of loss, the adjuster might count the number of damaged plants in a representative area to estimate the amount of loss.
These traditional “boots on the ground” methods of counting plants increase the risk that agents will damage fragile plants. Not only that, using these methods is time-consuming—and the results are still just estimates, not an exact accounting. Miscalculating the number of plants can result in under- or overcoverage, which leads to underpayments or overpayments. Overpayments cost you money; underpayments result in a dissatisfied customer.
Drones & Zones Expand Your Field of View for a Better Plant Count
To help crop insurers move from estimates to precise plant counts, PrecisionHawk combines drones, sensor hardware, machine vision, and machine intelligence into a system that quickly collects, processes, and analyzes crop data. The Zonal Statistics tool included the solution is a key component for obtaining the most accurate plant counts. The result: A fast, cost-efficient, precise accounting that lets crop insurers make better business decisions.
Here’s how the solution works, from collecting the data to creating actionable reports.
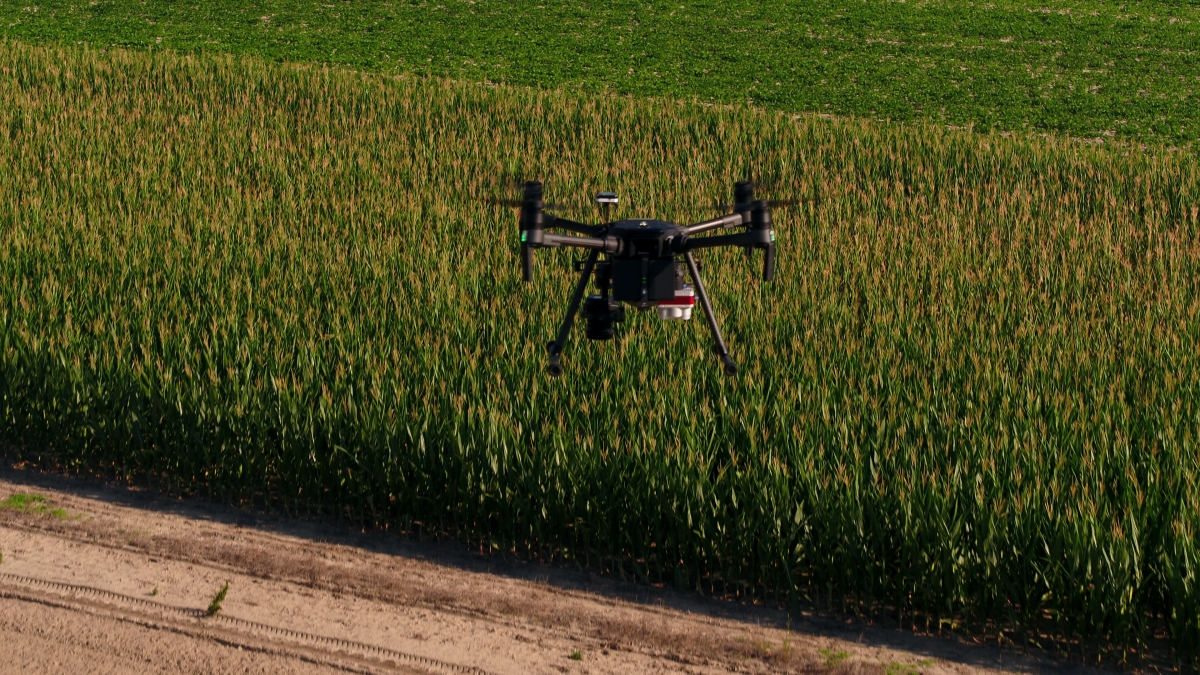
1. Adjusters or flight operators deploy drones and sensor hardware collect the data.
When a claim is filed or you’re quoting a new policy, credentialed drone operators—PrecisionHawk’s, yours, or a third party’s—use flight software to execute drone flights tailored to the situation’s specifications.
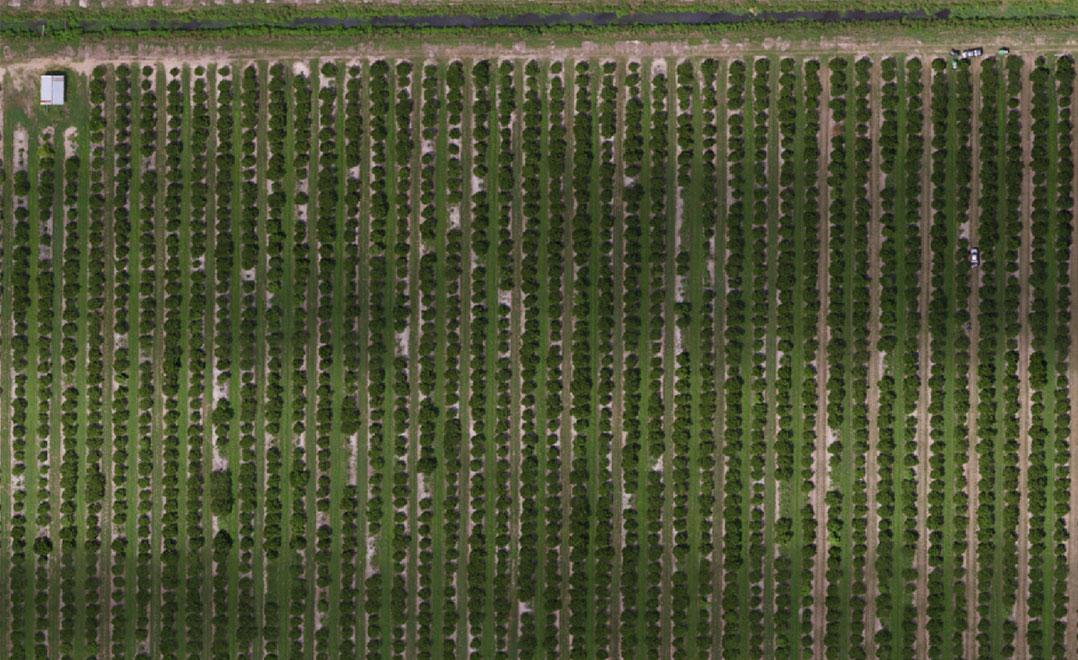
Drone surveys reduce the scouting process from days to hours—and sometimes even less, with adjusters being able to assess 200 acres in 20 minutes—and gather imagery on every acre rather than just a representative area. PrecisionHawk’s drone portfolio includes standard multicopter drones plus a range of fixed-wing and Vertical Take-Off and Landing drones. Using the right drone hardware lets operators fly low and slow to distinguish between leaves and shadows, ultimately providing a more accurate count. The drones are fitted with RGB sensors that provide crisp, accurate images.
2. Users upload the data into PrecisionAnalytics Agriculture.
This software, based on 10 years of agriculture analytics experience and millions of acres of crop data, uses machine vision and machine intelligence to produce rich data visualizations and automatically process, organize, and annotate geospatial data.
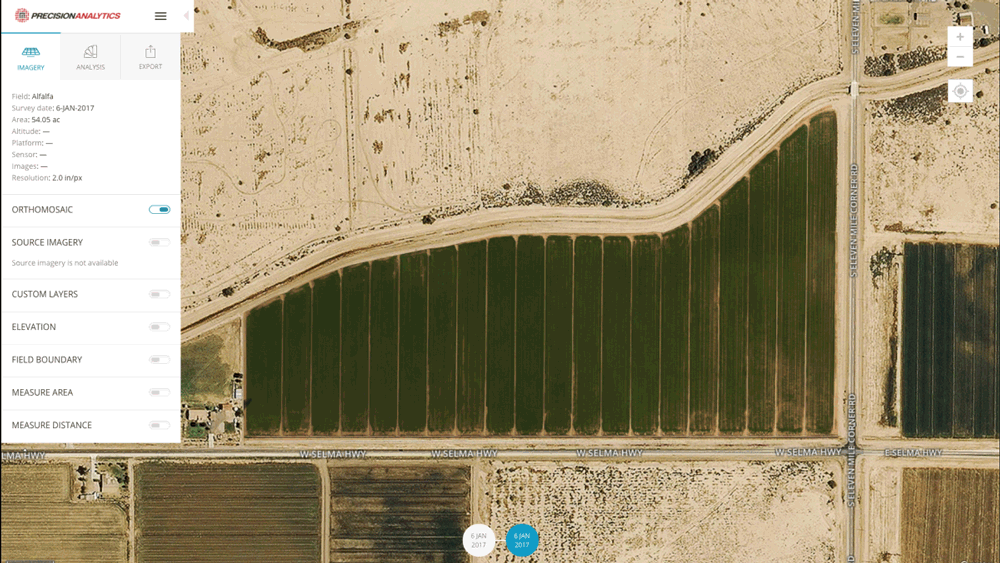
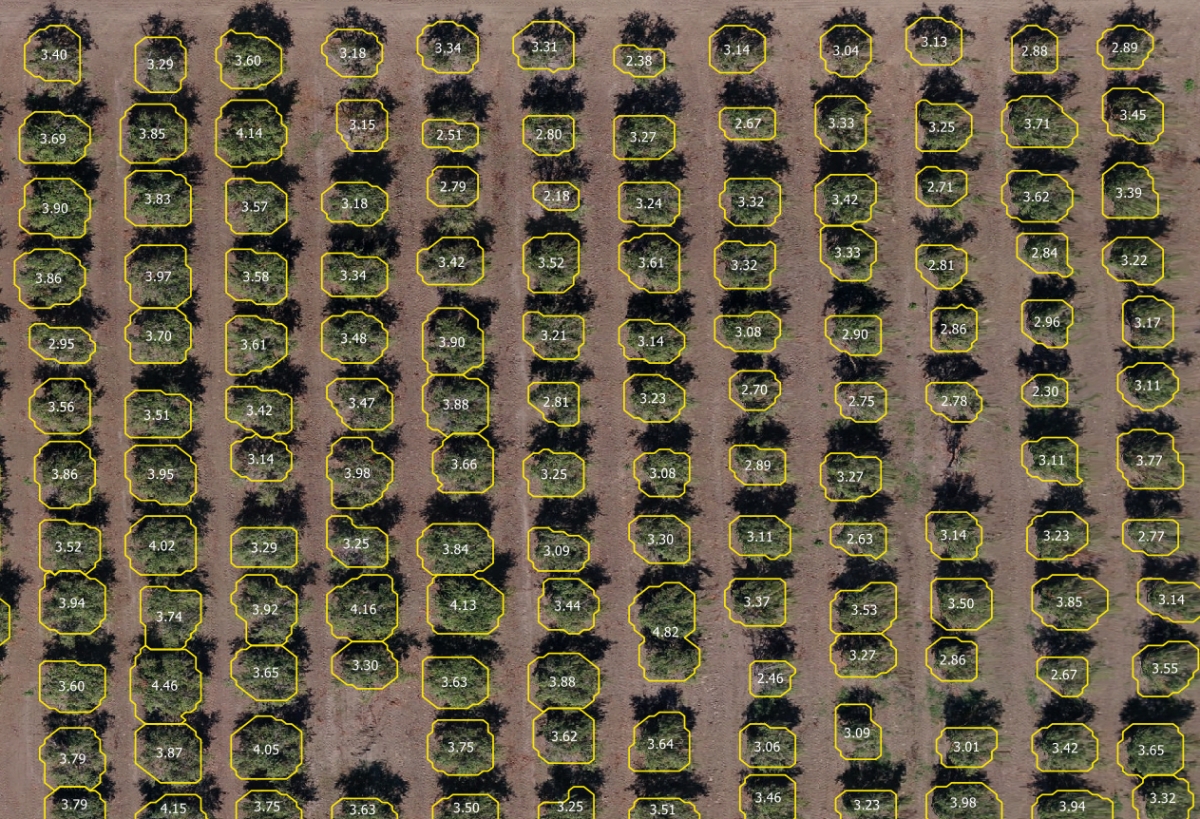
3. Crop insurers define zones to get accurate plant counts.
Using the Zonal Statistics tool within PrecisionAnalytics Agriculture, adjusters can:
- Shape their analysis to the unique characteristics of a field by defining custom zones.
- Save time by using the instant grid tool to quickly define plots and refine boundaries with an intuitive point-and-click interface.
- Calculate aggregate statistics on an area-by-area basis—from small plot to large zone.
- Export statistics for each area.
Then, PrecisionAnalytics’ plant count tool comes into play. This is an algorithm that enables crop insurers to automatically quantify their crops by zone. The plant counting algorithm automatically detects plants—from seedlings to full canopies—and places a marker over the canopy to count it. These colorized dots indicate whether the plant canopies are small, medium, or large relative to one another. For orchard crops like citrus and nut trees, the algorithm produces a highly accurate count even when the canopies grow together in a hedge—so insurers can always get a highly accurate count of the plants in their predefined zones.
Crop insurers using PrecisionAnalytics Agriculture to perform corn stand counts have been able to achieve at least 93% accuracy when flown during the optimum growth stage. As a result, adjusters are better able to calculate the correct coverage and payments.
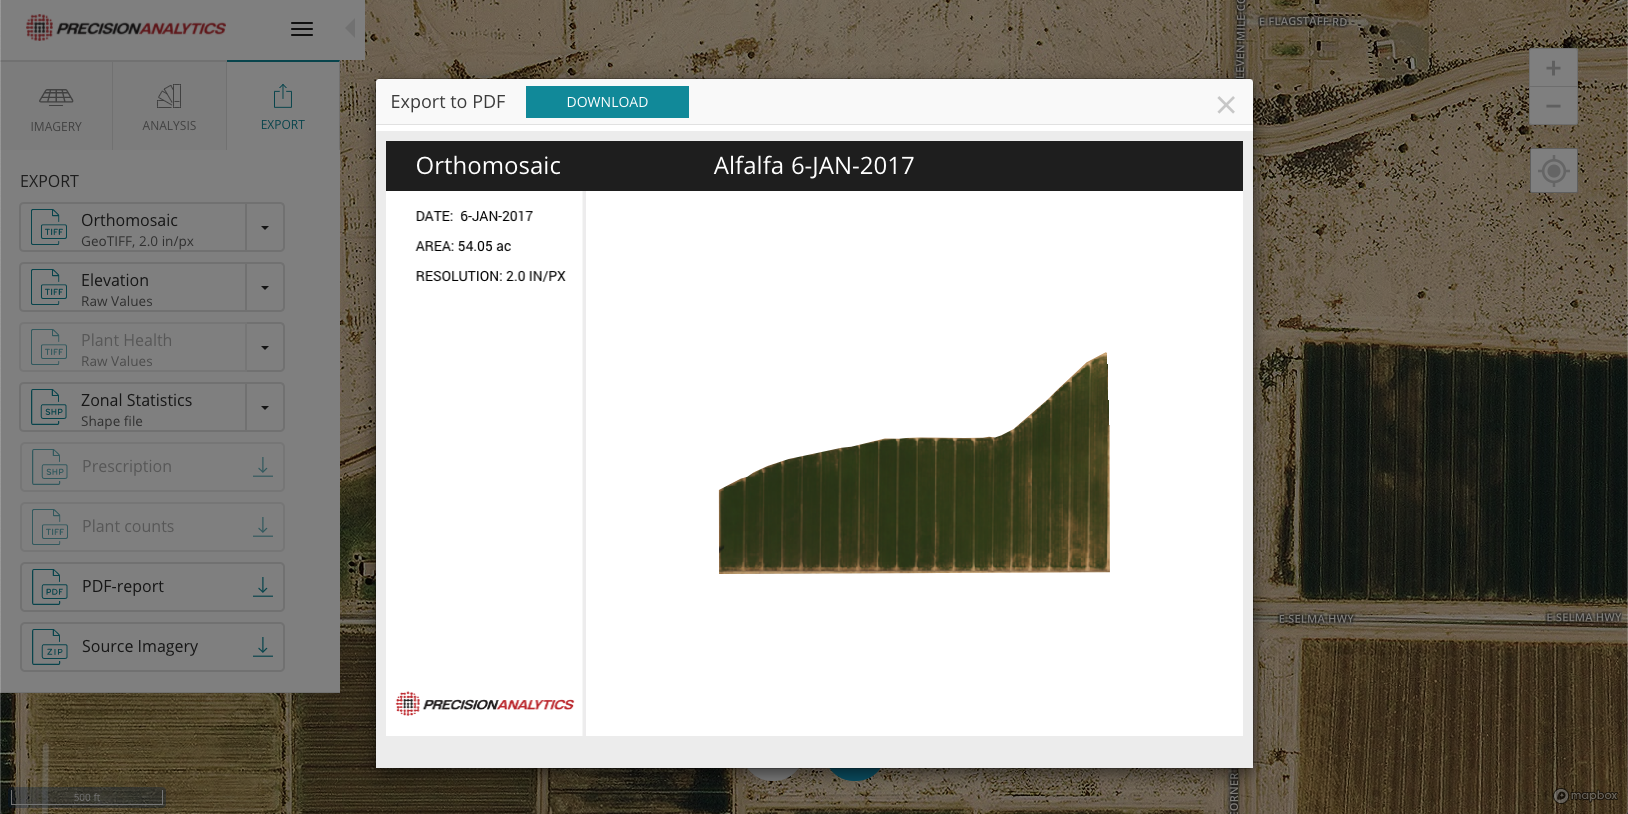
4. PrecisionAnalytics Agriculture generates reports for crop insurers.
Users can generate two types of report for each zone:
- Dynamic PDFs for specific data such as orthomosaics, plant counts, and source imagery.
- Live links that can be shared with non-PrecisionAnalytics subscribers. With this feature, a wide variety of stakeholders can obtain information quickly and on a project-by-project basis, decreasing the time to action and making the process of analyzing data more efficient.
These reports are are easy to read, shareable, and easily imported into an existing data management system.
5. The insurer takes the correct action based on the reports.
The reports are used to calculate policy coverage and claims payouts, and can be shared with the customer to increase transparency, support the payout decision, and improve the customer experience.
For larger insurers managing many policies, PrecisionHawk offers Data Services to streamline and accelerate reporting and decision-making.

Why PrecisionHawk?
Our software was developed through collaborations with leading agronomists. With years of experience collecting data in the agriculture industry and using aerial mapping to count crops, our data scientists and engineers have developed some of the best-trained machine learning models in the industry.
PrecisionAnalytics Agriculture’s Zonal Statistics tool helps crop insurers offer more accurate coverage and payouts, increasing efficiency and customer satisfaction.
We’re here to help you adopt more efficient and effective crop inspection practices. Our experts will assist you in evaluating when, where, and how to incorporate drone-based aerial intelligence into your operations. Our global network of drone operators is standing by to execute flights on your behalf. And our engineers are continuously optimizing PrecisionAnalytics Agriculture to better automate and accelerate your analysis.