

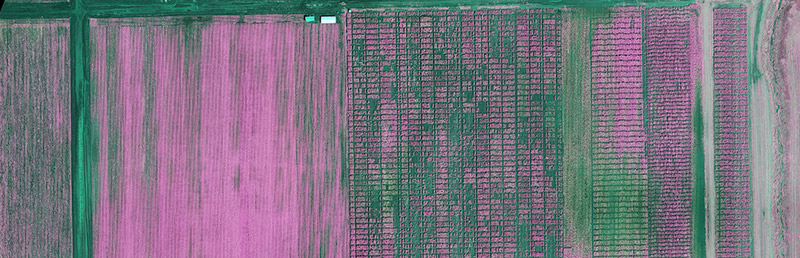
Hyperspectral sensors collect data as a series of narrow and contiguous wavelength bands providing a high level of performance in spectral and radiometric accuracy.
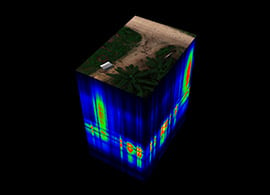
The datasets produced by hyperspectral imagers is in the form of a three-dimensional hypercube in which two dimensions represent the spatial information (x,y) and the third dimension representing the spectral information. You can use this detailed spectral information to identify subtle differences in vegetation, minerals and other materials.
“When you investigate different portions of the electromagnetic spectrum, it’s like looking at the same subject matter under a completely different microscope. How that object interacts with incident light changes based upon the wavelength of energy, or spectral band, recorded,” shared Jason San Souci, GISP, a Remote Sensing Scientist and GIS Strategy Expert.
The sensors produce narrow bandwidths (5-10 nm) and secure roughly 100 to 200 spectral bands of data per image pixel. The data is collected as a three-dimensional hypercube with x, y and λ values.
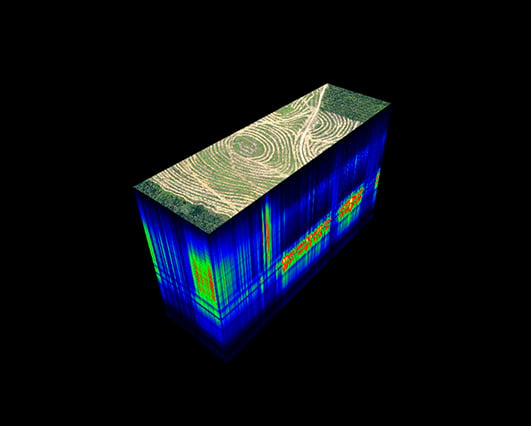
Each pixel gets its own spectral profile containing location data, followed by hundreds of digital numbers that align with the corresponding spectral bands.
Needless to say, hyperspectral sensors capture gigabytes (and sometimes even terabytes) of data depending upon the size of the survey area.
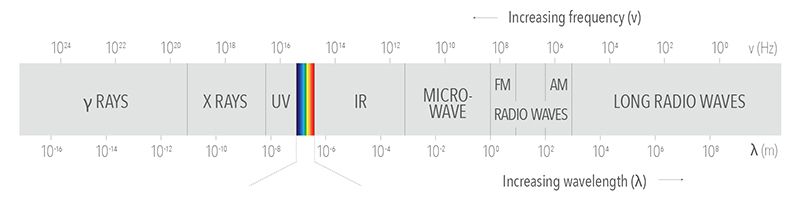 Electromagnetic spectrum
Uses of Hyperspectral Sensors
The sensors are instrumental in plant health measurement, plant disease identification, water quality assessment, vegetation index calculations, mineral and surface composition surveys, fill spectral sensing and spectral index research.
A sampling of top use cases across industries includes:
Energy
Evaluate surface outcrops and hydrocarbon seepage for upstream and downstream oil and gas operations.
Insurance
Ensure assessor safety after hurricanes and flooding by detecting debris, oil and gas that is floating on the water.
Government
Detect and classify encroachments in right-of-ways to reduce risk and accelerate inspections.
Agriculture
Protect against yield loss through the early detection and identification of diseases.
Construction
Identify tree species to remain compliant with laws and ordinances related to tree protection and preservation.
Flight Planning and Data Collection
Build your flight plan around the project’s data output and resolution requirements.
Ground Sampling Distance (GSD or ground resolution) is the distance between pixel centers measured on the ground. Be sure you reach the altitude required to meet your survey’s GSD needs.
The spectral identification of surface materials is best accomplished by calibrating the data to surface reflectance to remove the effects of atmosphere, the solar illumination and instrument biases. When collecting data with hyperspectral sensors, you should use reflectance panels.
Reflectance panels reflect light at known levels and normalize the captured data to the lighting conditions of the date, time and location.
“Before and after each flight, secure images while flying over a reflectance panel. This gives you a baseline for the amount of light reaching the ground during that portion of data collection and is essential for calibration during processing,” shared Matt Tompkins, Director of Flight Operations.
Ground control points also need to be identifiable in the imagery.
Hyperspectral sensors are like a scalpel that allows you to dissect exactly what is happening within very narrow bands of spectral content. Multispectral sensors are like a broad sword that collects less intensive spectral data.Jason San Souci, GISP, Remote Sensing Scientist and GIS Strategy Expert

Jason has 16 years experience in hyperspectral remote sensing, including over 1,000 hours commanding combat Intelligence, Surveillance and Reconnaissance (ISR) missions over Afghanistan.
Data Management and Delivery
Processing and data analysis is the same regardless of how you collect hyperspectral data, whether it be by satellite, fixed wing or drone. The only changing variable is temporal resolution, which is the amount of time between revisits to acquire data for the exact same location.
“The complexity of hyperspectral data makes it difficult to know whether you have captured quality data,” shared Jason San Souci, GISP. “Learning the tricks of the trade will give you an indication or reasonable level of confidence that the data is going to turn into a good product.”
While still in the field, be sure to preview and process the data using the specialized software created by the sensor manufacturer. You’ll be able to do a quick review of an RGB product (orthorectified data cube) to check for any issues such as distortion.
Image processing and data analysis should take place back in the office using remote sensing software platforms such as Environment for Visualizing Images (ENVI) or MATLAB.
Hyperspectral Sensor Comparison |
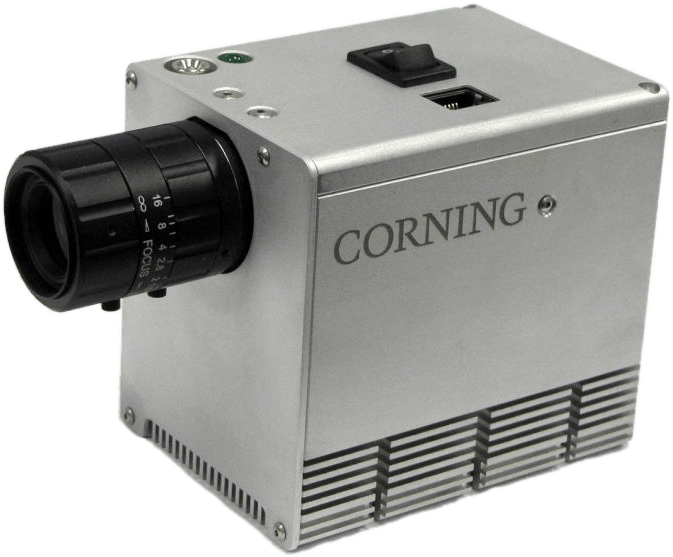 Corning® microHSI™ 410 SHARK Corning® microHSI™ 410 SHARK |
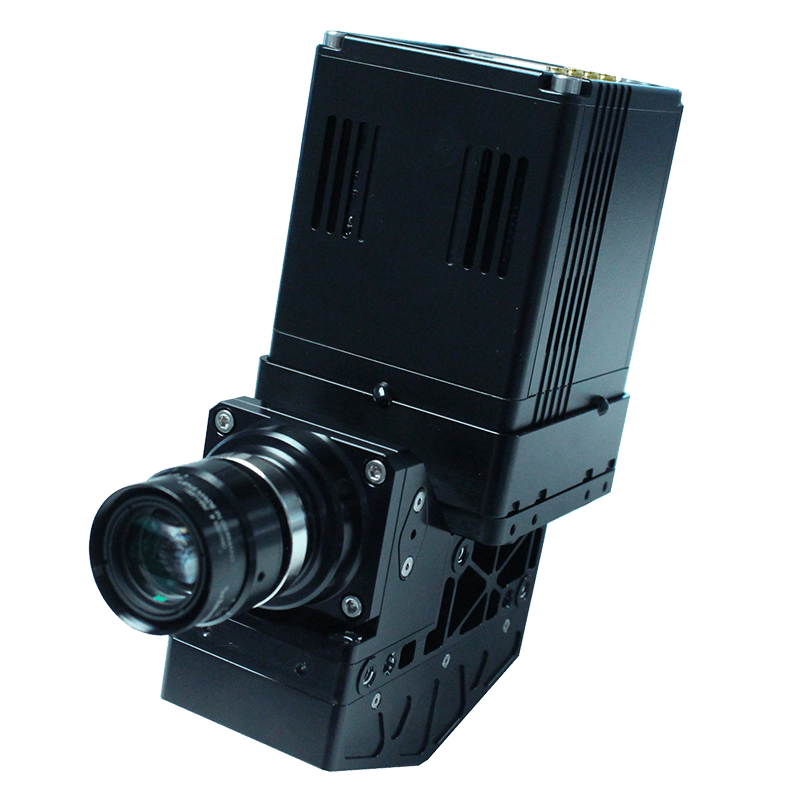 Headwall® VNIR E-Series Headwall® VNIR E-Series |
|---|---|---|
| Spectral Range | 400-1000 nm | 400-1000 nm |
| Max. Frame Rate | >300 Hz (profile dependent) | 250 Hz |
| Weight | 1.5 lbs (standard lens, data storage, INS) | 3.1 lbs (weight without lens) |
| Compatible Drones | DJI Matrice 600, xFold Travel and Dragon | DJI Matrice 600, xFold Travel and Dragon |
Hyperspectral & Multispectral Sensors: The Differences
"Hyperspectral sensors are like a scalpel that allows you to dissect exactly what is happening within very narrow bands of spectral content. Multispectral sensors are a broad sword that collects less intensive spectral data,” shared Jason San Souci, GISP.
Hyperspectral gives you better capabilities to see what you can't see with multispectral. It is for projects where you need discrimination power like identifying a specific disease impacting your crop and assessing severity levels.
Hyperspectral & Multispectral Sensors: Working Together
Projects that involve hundreds of acres are ideal opportunities for a sampling strategy that uses multispectral and hyperspectral sensing.
You can examine the entire project area using a multispectral sensor and then use the hyperspectral sensor to get a closer inspection on any areas that look different.
When you secure an actionable amount of samples, you’ll have an understanding of what's going on in that particular area (and vice versa).
"Hyperspectral sensors can be used to determine if a multispectral sensor could get the job done without reducing accuracy. Learning exactly what bands are needed for specific use cases allows you to create a custom multispectral filter for the purposes of cost-effectively securing the data you need,” stated Jason San Souci, GISP.