In this blog, we’ll share several updates to PrecisionAnalytics Energy. To schedule a demo, get in touch.
When we launched PrecisionAnalytics in 2019, we set out to help energy enterprises use geospatial data analytics to better manage their assets. Since then, we’ve learned more about how America’s largest utilities analyze their data and put it to work across their organization. Based on these insights we’ve developed three key improvements to our flagship software:
-
A stronger AI-powered asset tagging engine that’s accelerating data processing and making it more accurate
-
A side-by-side thermal and visual imagery interface, which enables faster assessment of component anomalies
-
Asset filters for drilling down into distribution components by type, issue severity, and other measures of interest
“We’ve designed key improvements to our product that allow operational staff to view the data and systems that matter most to them. We’ve also expanded their ability to harness their data into a useable format with the relevant systems-level connections.”
—KRISTEN ELLERBE, VP OF PRODUCT
Advancing the PrecisionAnalytics AI-Powered Tagging Engine
Every operations team has journeymen they trust to deliver high-quality analysis during and after each visual inspection. PrecisionAnalytics is built to replicate and scale the knowledge of these experienced inspectors, and put their knowledge to work through a software system capable of processing an ever-growing amount of visual and geospatial data.
We’ve advanced our PrecisionAnalytics tagging engine and are now rolling it out at a production scale to streamline data collection and analysis—making it easier for utilities to start using GIS intelligence and expand their capacity to address, and then resolve, system-wide challenges.
The AI models are designed to process visual and thermal imagery. Users can manually tag images to train the model how to better catch issues. The result is a more accurate model that reduces the potential for human error while accelerating comprehensive data analysis.
Our clients are already benefiting from the growth of our AI-powered tagging engine. It’s based on 22 production-ready models, making it versatile to a wide variety of electrical assets and analytical use cases. Now, users can analyze a wider range of assets—at a greater degree of recall and precision.
Side-by-Side Review: Incorporating Thermal Data Alongside Visual Imagery
The greatest efficiency gain utilities can realize is by reducing the noise—the sheer quantity of images, components, checklists, or reports that need to be viewed manually—in order to identify the most pressing issues. By using an AI-powered software engine to confirm thermal anomalies side-by-side with visual imagery, utilities can move away from deploying ground teams to confirm anomalies in the field.
“We’ve built this entire system on a robust API layer, knowing from dozens of customer interviews that PrecisionAnalytics Energy must go beyond addressing a problem—we’re helping companies identify solutions by integrating into current workflows that make the data available across the organization.”
—KRISTEN ELLERBE, VP OF PRODUCT
With these goals in mind, we’ve added the capacity to analyze thermal data in PrecisionAnalytics, adding an additional layer of data that goes beyond the natural human line of sight. As reviewing and analyzing large sets of thermal imagery can be quite difficult—and costly—we’ve placed our thermal and visual AI-powered models next to each other, giving the user better geospatial awareness.
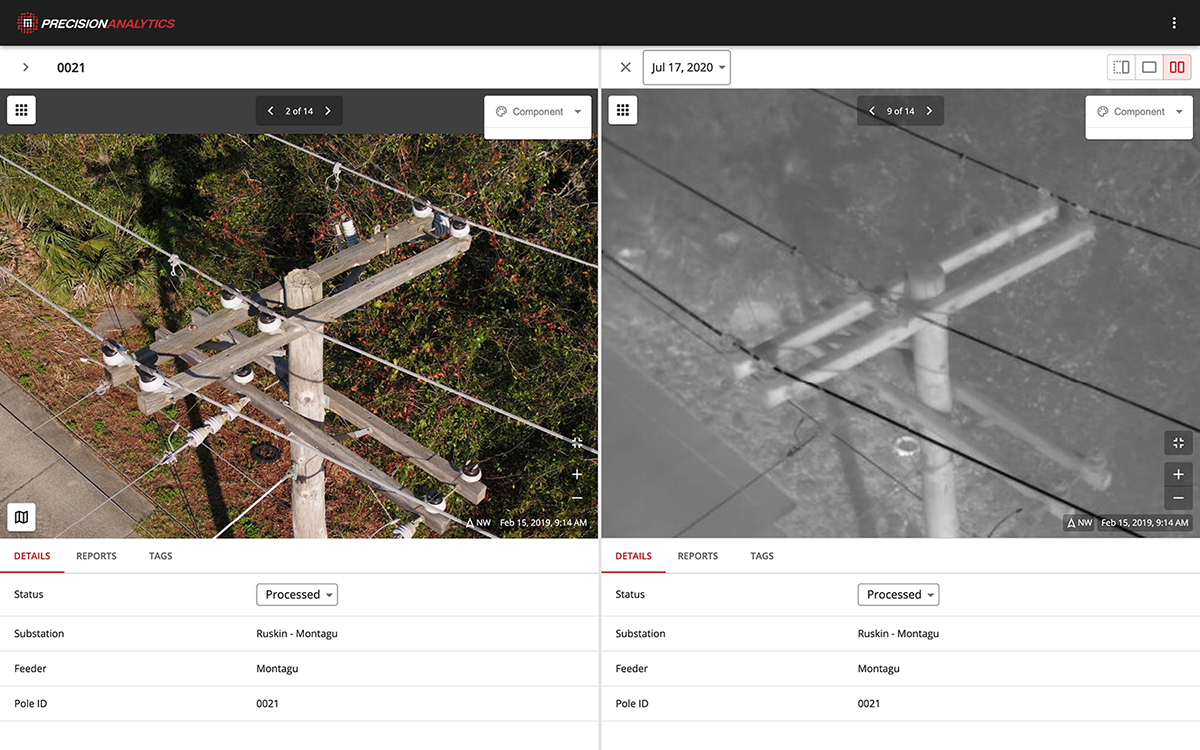
Rather than a thermographer manually reviewing tens of thousands of images, PrecisionAnalytics automatically flags a small subset of thermal images and displays those thermal images side-by-side with other visual imagery.
One customer found just 360 of 35,235 images contained thermal anomalies. That's about 1 percent.
“What we’ve built for our customers is the ability to quickly identify a hot spot and make an informed, practical decision—from a desktop rather than in the field.”
—KRISTEN ELLERBE, VP OF PRODUCT
Now, utilities can identify a hot spot and its location—and the context of what is happening in the image. For example, the user can identify the type of component, where the component sits in relation to others, or other potential damage to the component that isn’t thermal but would show up in other data gathered at the same time.
Asset Filters: Enhancing Reporting, System-Wide
Systems-level change accelerates the pace at which business decisions can be made. Paired with high-quality data, integrated and approachable reporting allows utilities to quickly identify, prioritize, and log issues, then optimize a cost-effective response.
That’s why we’ve expanded PrecisionAnalytics to include asset filters. Users are now able to narrow or widen their search of asset infrastructure or component anomalies by specific known issues. For example, users can drill down to broken components or blown switches, cracked or rotted wood, thermal hot spots, rusted metal, or vegetation encroachment. Users will soon be able to filter by issue severity, too.
“Artificial intelligence is only as strong as the quality of the data that you’re able to feed into it. As the volume of available thermal, visual, and geospatial data increases, our ability to manually process data will actually be outpaced by our enhanced abilities to collect data. That’s why systems need to be built to process the data that you’ve collected, turning your geospatial data and physical, viewable imagery into actionable insights.”
—KRISTEN ELLERBE, VP OF PRODUCT
Ultimately, the addition of asset filtering will enhance reporting, system-wide, by reducing the noise in feeder-level and network-level analytics. Users across the company can easily access data and reports, customized for their teams. Having a database isn’t enough if you’re not able to derive actionable information from it.
Empowering Action
PrecisionAnalytics uses machine learning and proprietary AI decision models to cross-reference uploaded thermal data and visual imagery against asset data and flagged issues, resulting in rich information prioritized by asset health and severity.
Utilities are already deploying PrecisionAnalytics to find solutions for pressing challenges through building data systems that remove manual steps while increasing accuracy. Leading utilities are prioritizing work orders according to risk, identifying deltas in asset counts and locations, monitoring and analyzing trends in a group of assets over time, and producing powerful geospatial maps, models, and measurements. Using PrecisionAnalytics, utilities can quickly draw insights from their geospatial data and take action on the critical issues impacting their electrical asset operations.
Learn how PrecisionAnalytics Energy can help you quickly identify trends and issues in your asset infrastructure.