Our software platform includes full access to the Algorithm Marketplace, the first and only library of automated, analysis tools available for drone data. The marketplace uses remote sensing science and GIS technology to function like an app store for drone operators who want to convert their raw aerial imagery into an action based report. To date, the marketplace has over a dozen commercially available algorithms and over 200 in the pipeline. Join us in the next few weeks as we highlight the algorithms, from resource management to risk mitigation, that help our clients gain better understanding of their business operations.
Featured Algorithm: Scout View Report
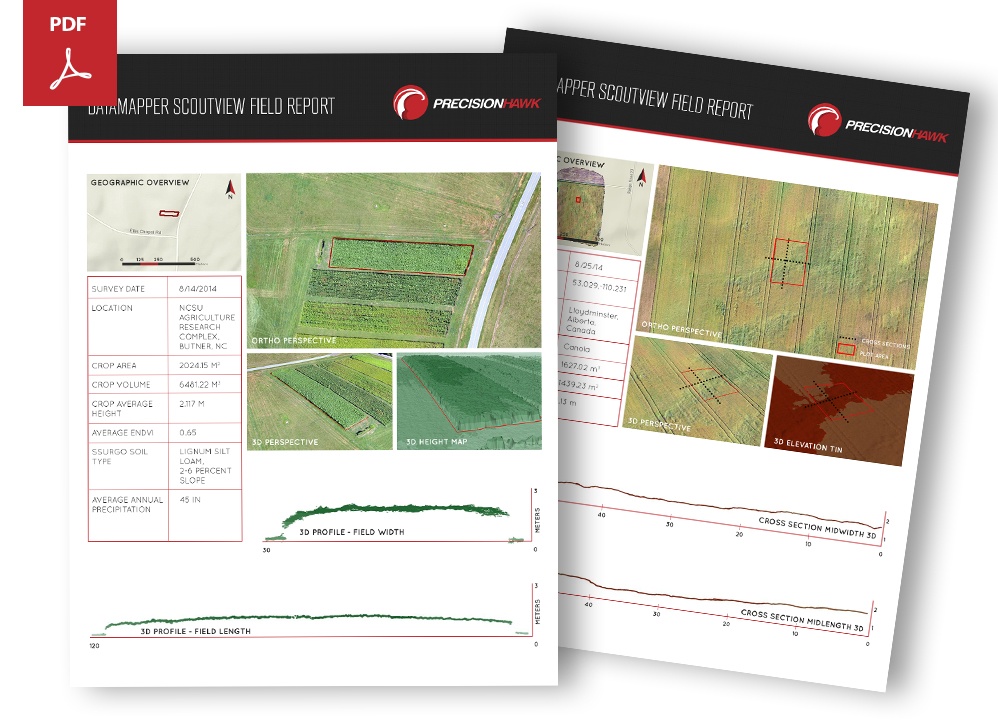
The successful application of algorithms to aerial data depends on the user’s strategic ability to identify the type of information that is most relevant to their situation. It’s here that the Scout View Report emerges as a valuable tool. Crop scouting isn’t totally new to farmers. The Scout View Report, however, drastically reduces the time and resources involved, effectively increasing operational tempo. In this report, a user receives a one-page snapshot of the surveyed area that contains relevant site-specific data, in 2D and 3D views, that helps determine areas that need to be explored further.
The Scout View Report is one of our most requested analysis products. It is not sensor specific, so users can bundle it with more focused solutions and stack data products without flying multiple surveys.
Primary Elements:
Geographic Overview: The geographic overview contains typical map elements that show a user where the area of interest is with respect to its immediate surroundings.
Field Overview: The field overview is a collection of identifiers pertaining to a user’s area of interest, including the survey name, date & location, sensor used, soil type, ground slope, crop plot area, crop height average, and annual precipitation levels.
Ortho Perspective: An ortho perspective offers a zoomed-in image of the survey area, highlighting the main area of interest.
3D Perspective: The 3D perspective provides a 3D height map and crop height profiles along the length and width of the area of interest. Usually, taller crops indicate the presence of weeds and other anomalies. While the 3D perspective offers some insight into crop height, this information is only qualitative and this is because crop height is relative to geographical factors. Our team runs other dedicated algorithms that take a field’s base slope and surface characteristics into account.
To receive a Scout View of your survey or to get more information about the Algorithm Marketplace, visit https://www.datamapper.com/algorithms.
Need something we don’t have? Got a research or an idea for your own algorithm? We work closely with GIS experts, university researchers and enterprise clients to build and commercialize custom algorithms to keep the marketplace growing. Email us at info@datamapper.com.