One of major buzzwords of precision agriculture is the NDVI, short for the Normalized Difference Vegetation Index. It’s constantly thrown around - but do we really know what it means and how valuable it truly is? Let’s dive into one of our most popular algorithms and learn why it is such a powerful piece of information to have on the field.
Some History and Theory
The NDVI is far from new. Compton Tucker published a landmark paper in 1979 regarding the development and use of the index in satellite remote sensing [1]. By the 1980’s researchers would begin to use the NOAA’s AVHRR satellite to collect data and [2] to map dense green vegetation throughout the entire world. Even then, various use cases were already evolving. The NDVI helped scientists develop things like famine alarm systems and it was used to improve climate models. Until today, research on correlates of the index continue to get published.
So how did Tucker come up with the NDVI [3]? He based it on the fact that objects reflect and absorb various wavelengths in different amounts. Colors emerge because of the interaction between objects and light. Plants are special because light is an integral part of their lives. They have been found to absorb a lot of visible light, an energy source they use in photosynthesis. Conversely, their cell structure causes them to reflect a lot of near infrared (NIR) radiation. By comparing the reflectance of visual and NIR radiation, therefore, one can get a good idea of how dense the vegetation in an area is. This led to the now ubiquitous equation:

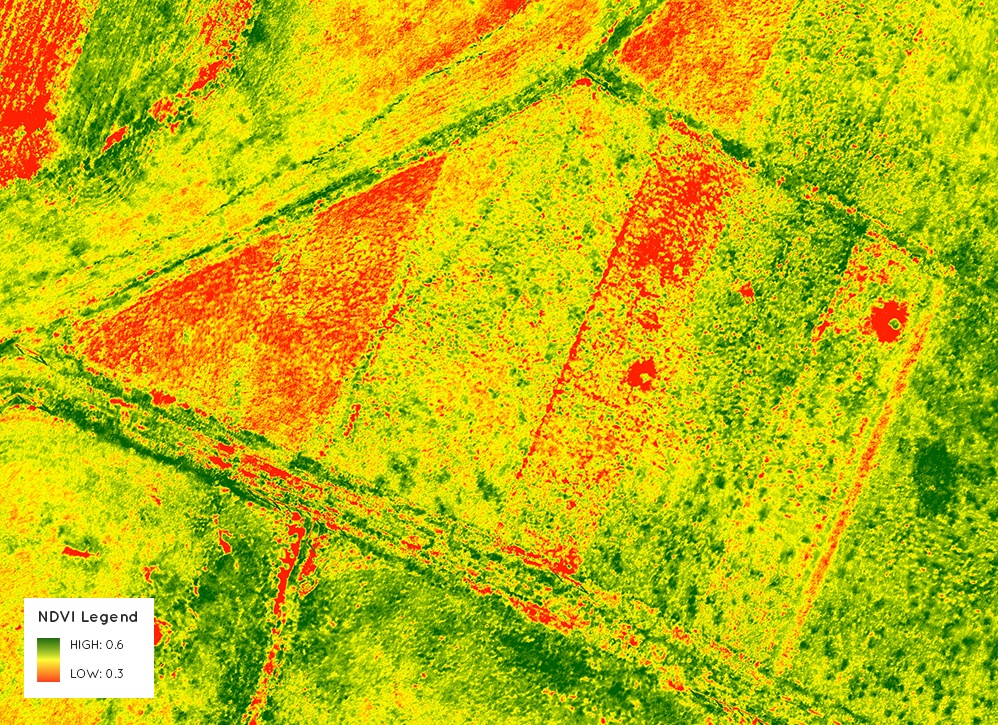
Mathematically, values should range from -1 to +1. In practice, the absence of vegetation in bare soil conditions typically result in a value close to zero while areas of dense vegetation will have values close to +1.
Putting it into Practice
Fast forward to today. From its beginnings as a tool developed for use in satellite remote sensing, the NDVI has now become an integral part of precision agriculture because of the level of insight it provides. Apart from its ability to discern the density of vegetation, the NDVI has also been found to be correlated to key agricultural outcomes such as crop yield [4,5], crop identification [4], leaf area index [6], and even plant health [7]. On the field, the NDVI will work best as a part of a robust agricultural data stack, one that brings together important information on various data points like plant height, soil type, soil moisture, and yield expectation. The company is currently working on developing the key elements of this data stack both internally and through its growing network of external partnerships.
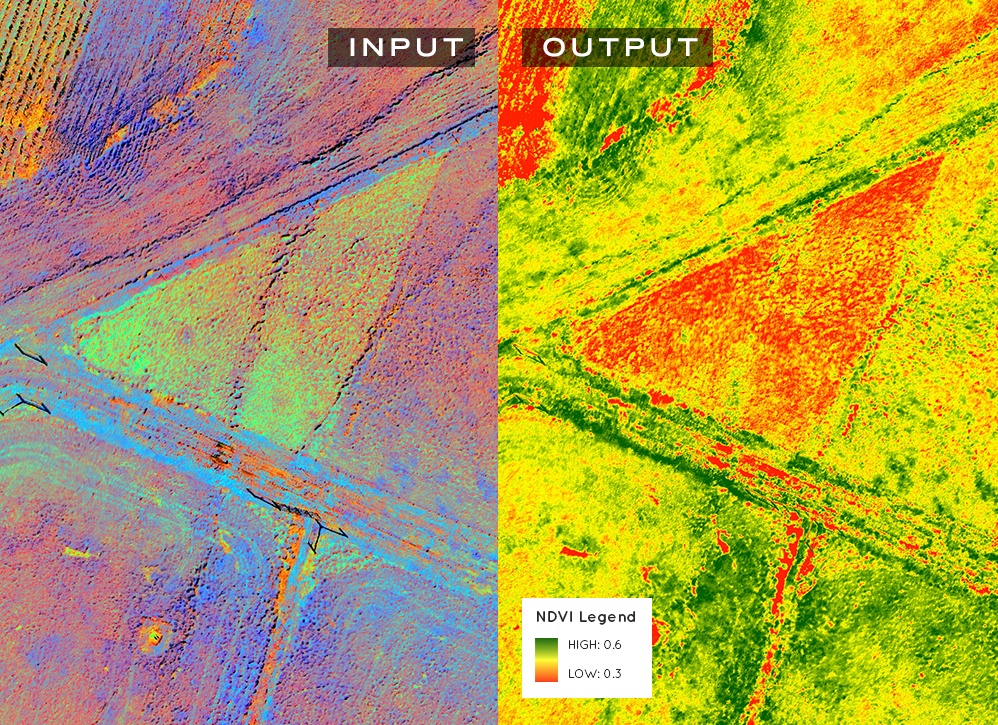
Integrated with a smart UAS platform like PrecisionHawk’s Lancaster, the NDVI becomes an even more powerful tool. It combines the speed by which one can deploy a drone to collect data with the richness of insight that the index inherently has. All these considered, the NDVI serves as a useful supplement or even substitute to traditional scouting. Imagine being able to quickly determine problem areas in the field based on regions with low NDVI values instead of relying on time-consuming practices that are also prone to human error.
The ease and availability of data also means that you can then quickly deploy field teams to examine specific problem areas, allowing them to diagnose issues more efficiently rather than spending time and resources scouring the field for answers. This makes time-sensitive events like the onset of certain diseases much more manageable. In the end, all these will benefit your bottom line--you spend less time and less resources while getting as much or even more insight than traditional agricultural methods.
One Index among Many
One very important thing to consider is that the NDVI may not always be the best vegetation index to use. Depending on the type of crop or the growth stage, other indices may be more appropriate. Fortunately, the AlgoMarket has you covered here as well. We currently offer a wide suite of vegetation indices to respond to the diverse needs of our clients. As we integrate new algorithms and expand our network of university partners, you can be sure that will we be offering even more vegetation indices to give you the most incisive data.
The AlgoMarket Advantage
Ready to reap the benefits of NDVI? Avail of NDVI through AlgoMarket, the very first algorithm
marketplace by Datamapper. Here you get the valuable insights of the NDVI through a quick and automated channel that will seamlessly integrate into your business operations. With the power of big data, you can now make even bigger decisions.
--------------
[1] http://www.washingtonpost.com/wp-dyn/content/article/2009/08/03/AR2009080300357.html
[2] http://earthobservatory.nasa.gov/Features/MeasuringVegetation/
[3] Tucker, C.J. (1979) 'Red and Photographic Infrared Linear Combinations for Monitoring Vegetation', Remote Sensing of Environment, 8(2), 127-150.
[4] Bolton, D. K., & Friedl, M. A. (2013). ‘Forecasting crop yield using remotely sensed vegetation indices and crop phenology metrics’, Agricultural and Forest Meteorology, 173, 74-84.
[5]Huang, J., Wang, H., Dai, Q., & Han, D. (2014). ‘Analysis of NDVI Data for Crop Identification and Yield Estimation’, Selected Topics in Applied Earth Observations and Remote Sensing, IEEE Journal of, 7(11), 4374-4384.
[6] Viña, A., Gitelson, A. A., Nguy-Robertson, A. L., & Peng, Y. (2011). ‘Comparison of different vegetation indices for the remote assessment of green leaf area index of crops’, Remote Sensing of Environment, 115(12), 3468-3478.
[7] Mahlein, A. K., Rumpf, T., Welke, P., Dehne, H. W., Plümer, L., Steiner, U., & Oerke, E. C. (2013). ‘Development of spectral indices for detecting and identifying plant diseases’, Remote Sensing of Environment, 128, 21-30.